Wind Tunnel - CFD Correlation of an FSAE Car
Lead Aerodynamicist · Formule ETS
Correlation of an FSAE aerodynamic model against reality: a wind tunnel with no rolling road, purpose-built rigs to replicate wheel wake. Fidelity rose from sub-80%% to +95%.
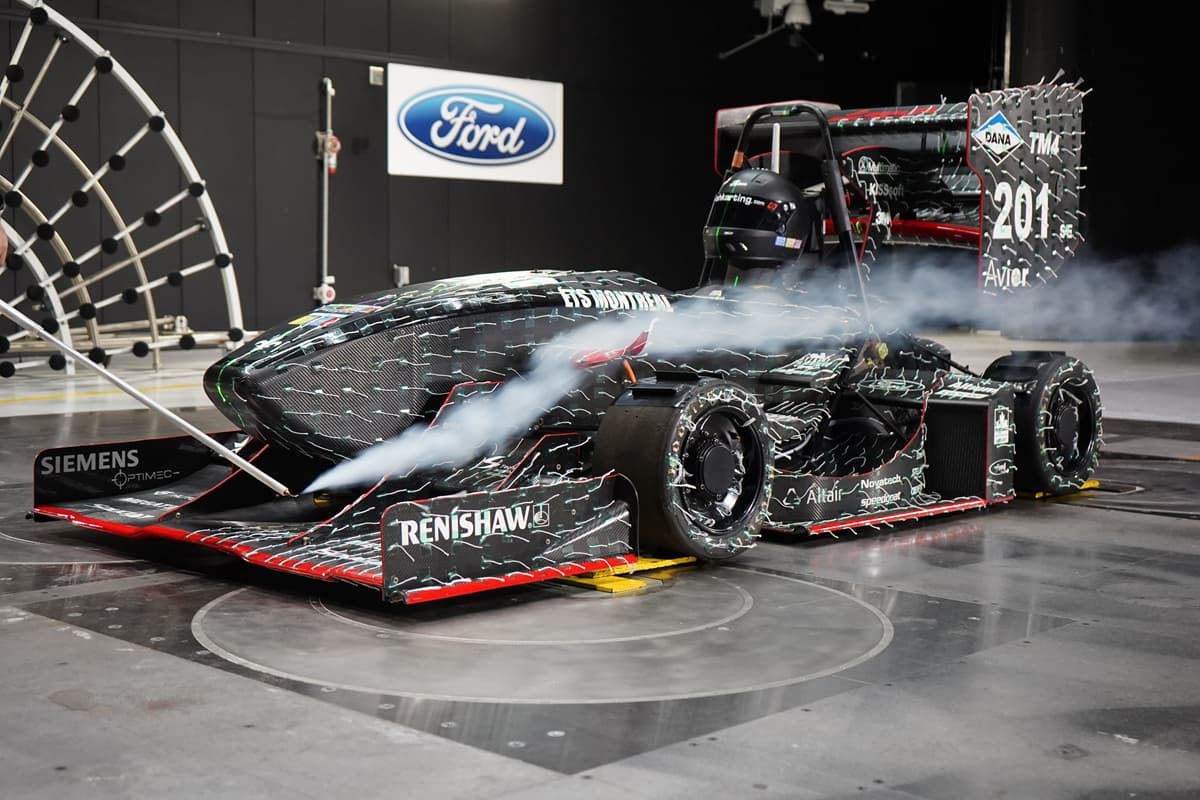
A CFD model nobody has checked against reality is a hypothesis. This is the work that turns Formule ÉTS’ aerodynamic simulations into something the team can design against — two campaigns in a full-scale wind tunnel, a second validation loop on track, and the rigs built to make a fixed-ground facility behave like a road.
The facility
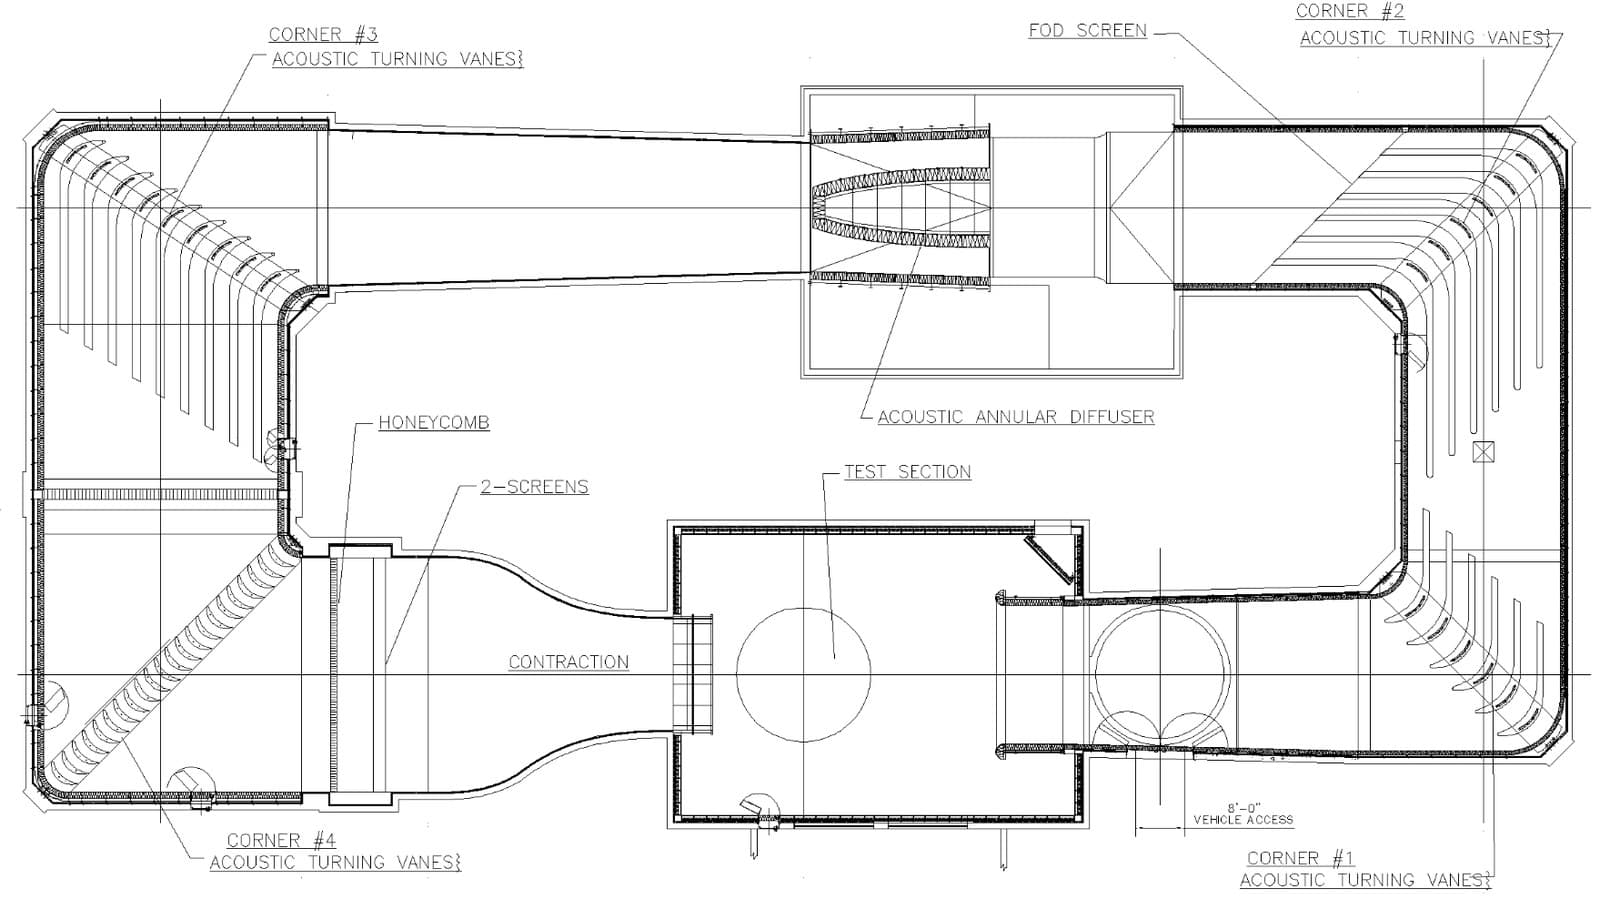
Tunnel 8 sits in Ford’s Driveability Test Facility in Allen Park, Michigan, and hosts around twenty FSAE teams a year. It is a closed-circuit, three-quarter open-jet aeroacoustic tunnel.
An 18.7 m² nozzle at 6:1 contraction drives air to 54 m/s, extensible to 67 m/s with a reduced insert. Forces come off a six-component external balance on a turntable, coupled to a two-wheel dynamometer with sub-50 ms transient response.
A tunnel with no rolling road
Tunnel 8 is optimized for aeroacoustics, not for ground-effect vehicles. It has no moving belt, so the floor boundary layer grows where a road surface would be sweeping it away. The facility compensates by injecting air through a floor slot upstream of the test section.
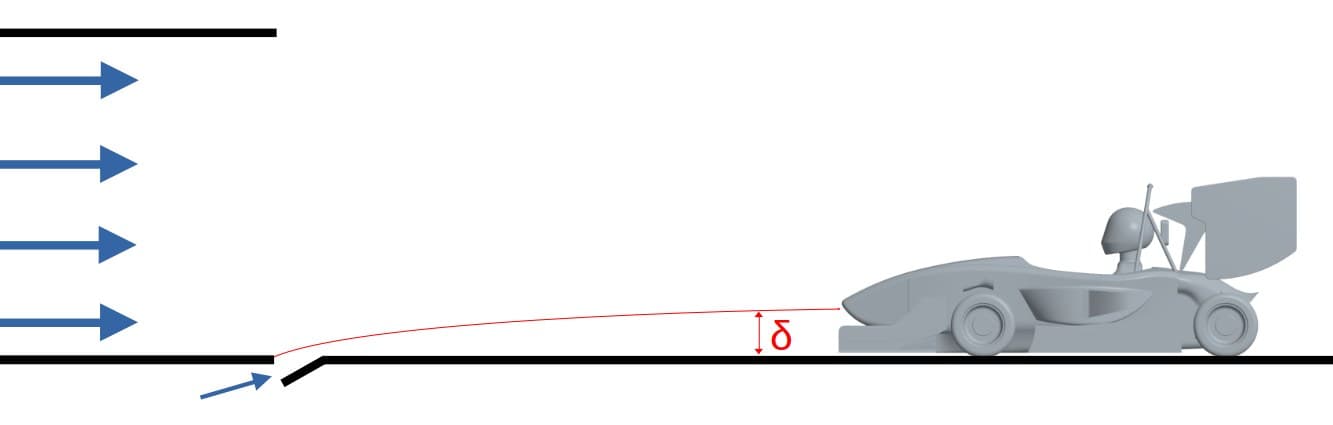
Matching that in CFD had three candidate answers, and only the third survived:
- Model the injection lip directly from the tunnel sensors and its published data — too complex to build for too imprecise a result. Rejected.
- Move the inlet closer to the car until the floor boundary layer matches the documented height, using Blasius’ flat-plate solution. Simple, but at low speeds the inlet ends up close enough to the car to damage solution stability. Not viable in a parametric model.
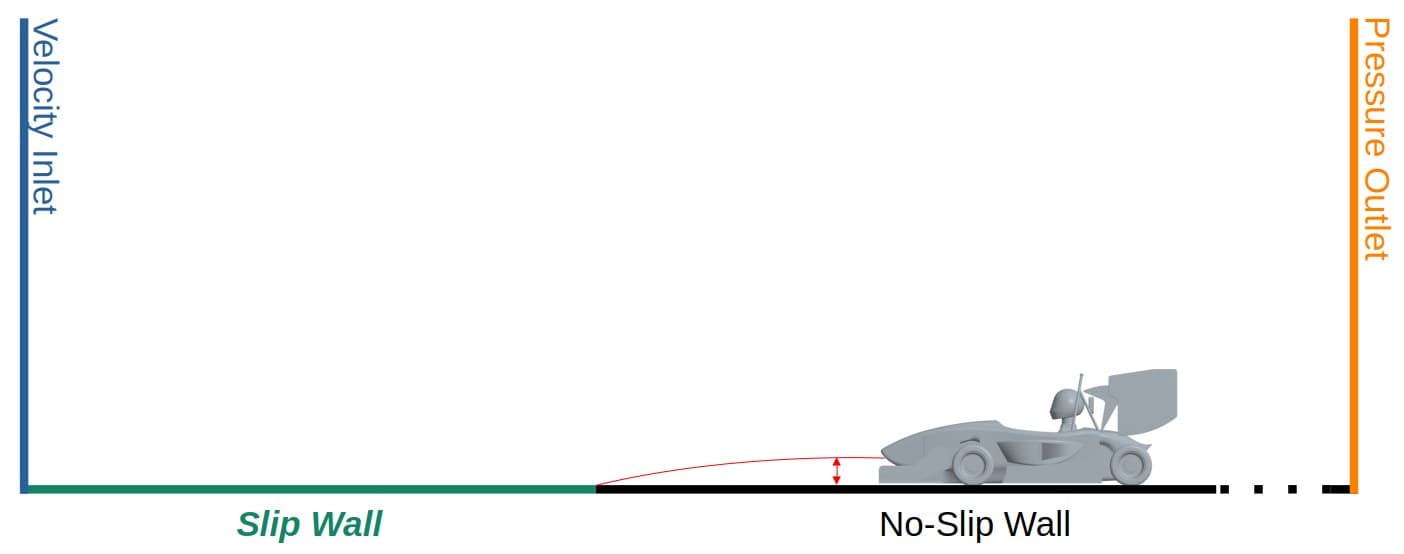
- Use wall shear boundary conditions. Upstream of the injection lip the boundary layer can be neglected, so the domain runs on a no-shear wall and transitions to a shearing one at a distance computed from Blasius. Adjustable, stable, and it holds parametrically.
Making a static wheel behave like a rolling one
The same missing belt leaves the wheels stationary, and a static wheel sheds a completely different wake from a rotating one. Fins were designed to force a stationary wheel to reproduce the wake structure the car actually generates on track.
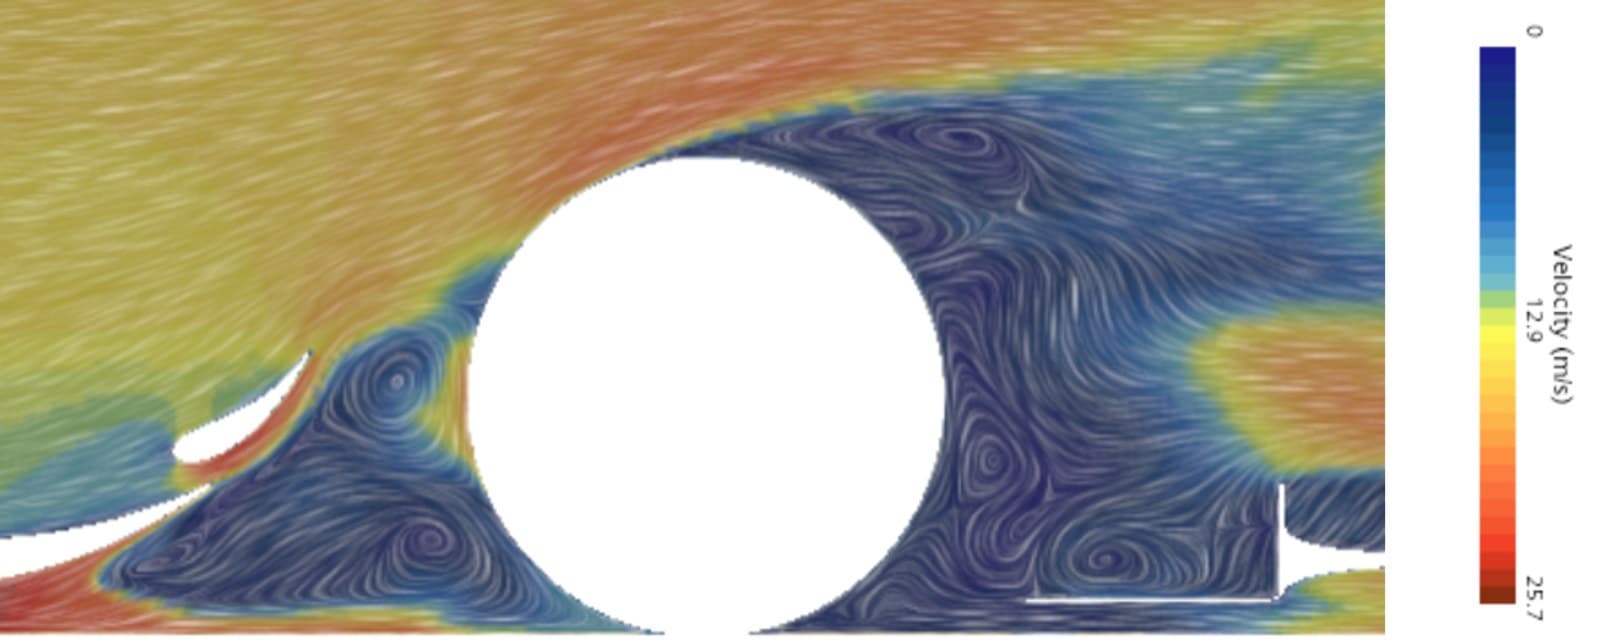
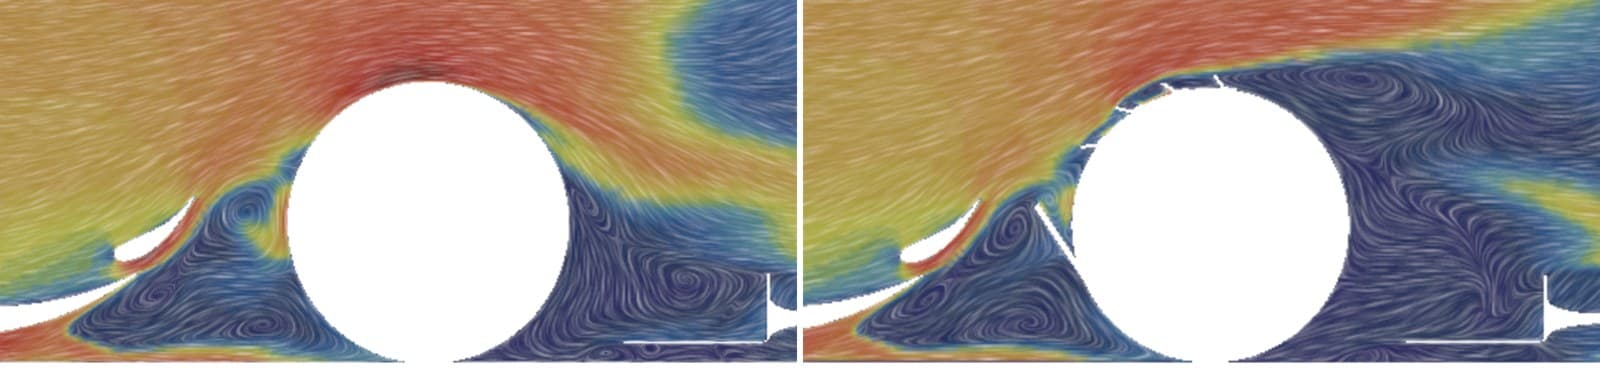
Results — force coefficients
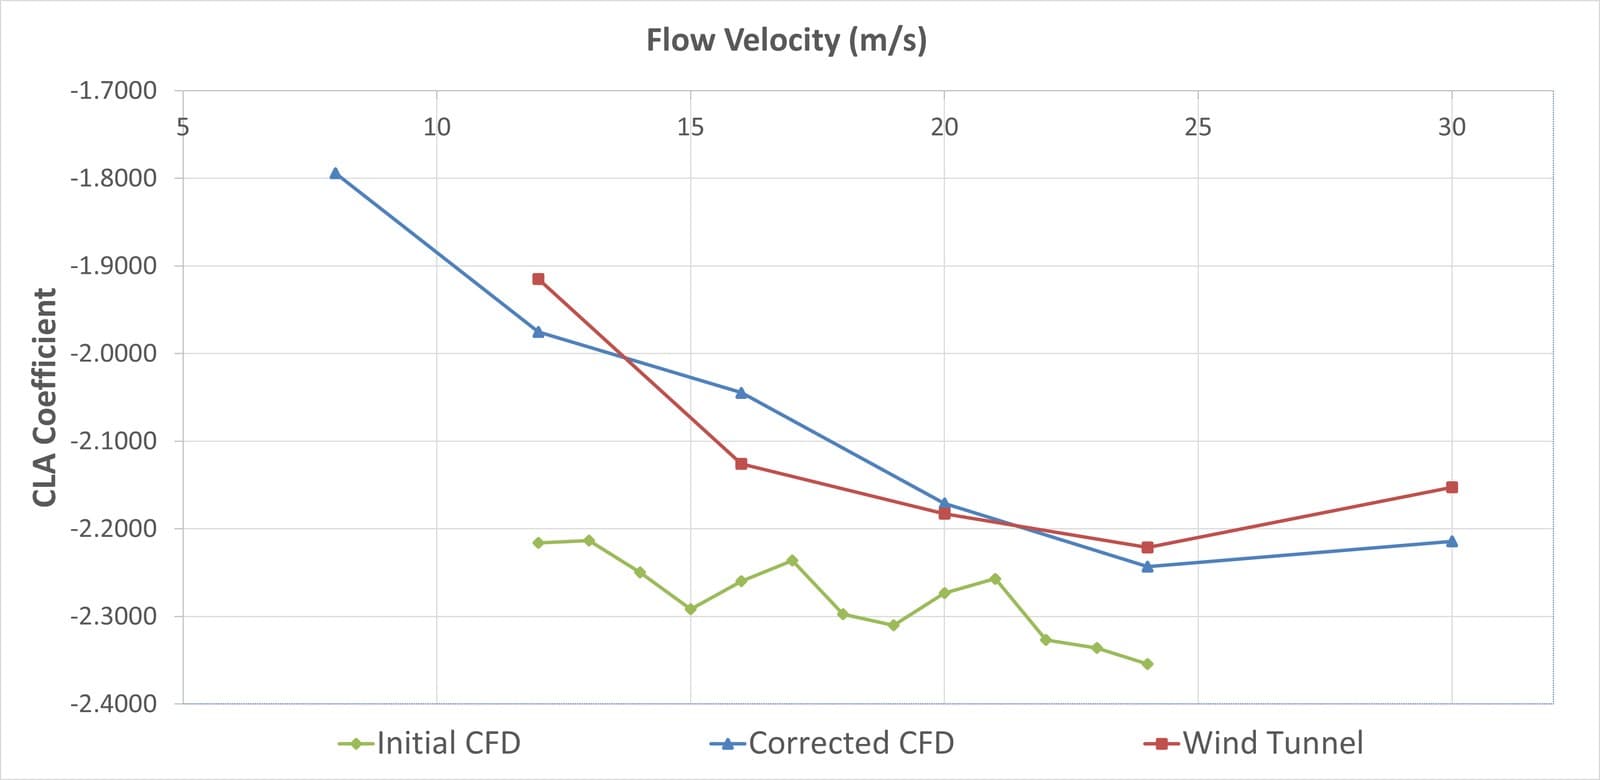
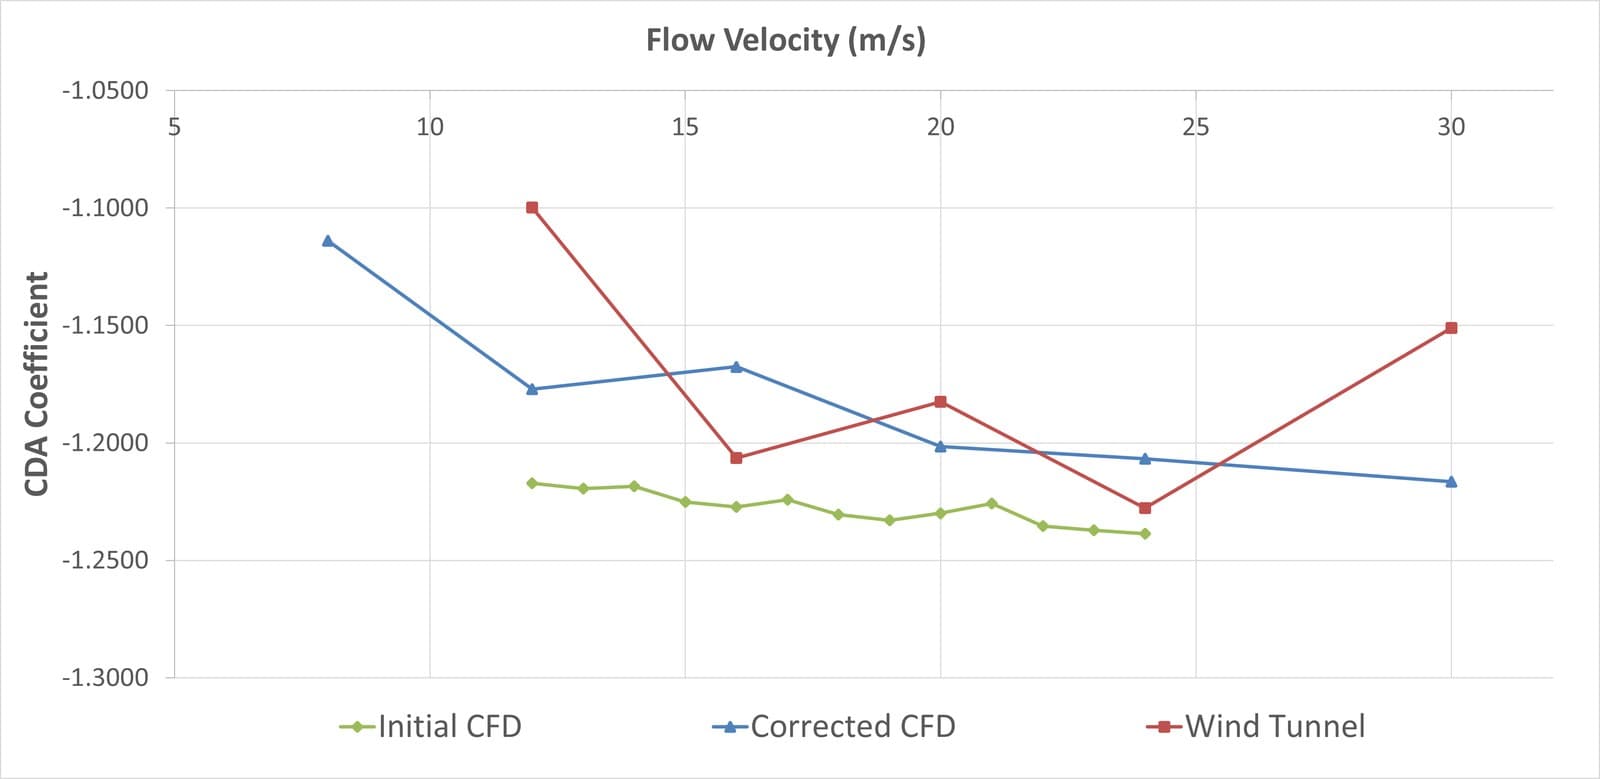
| Metric | Agreement | Note |
|---|---|---|
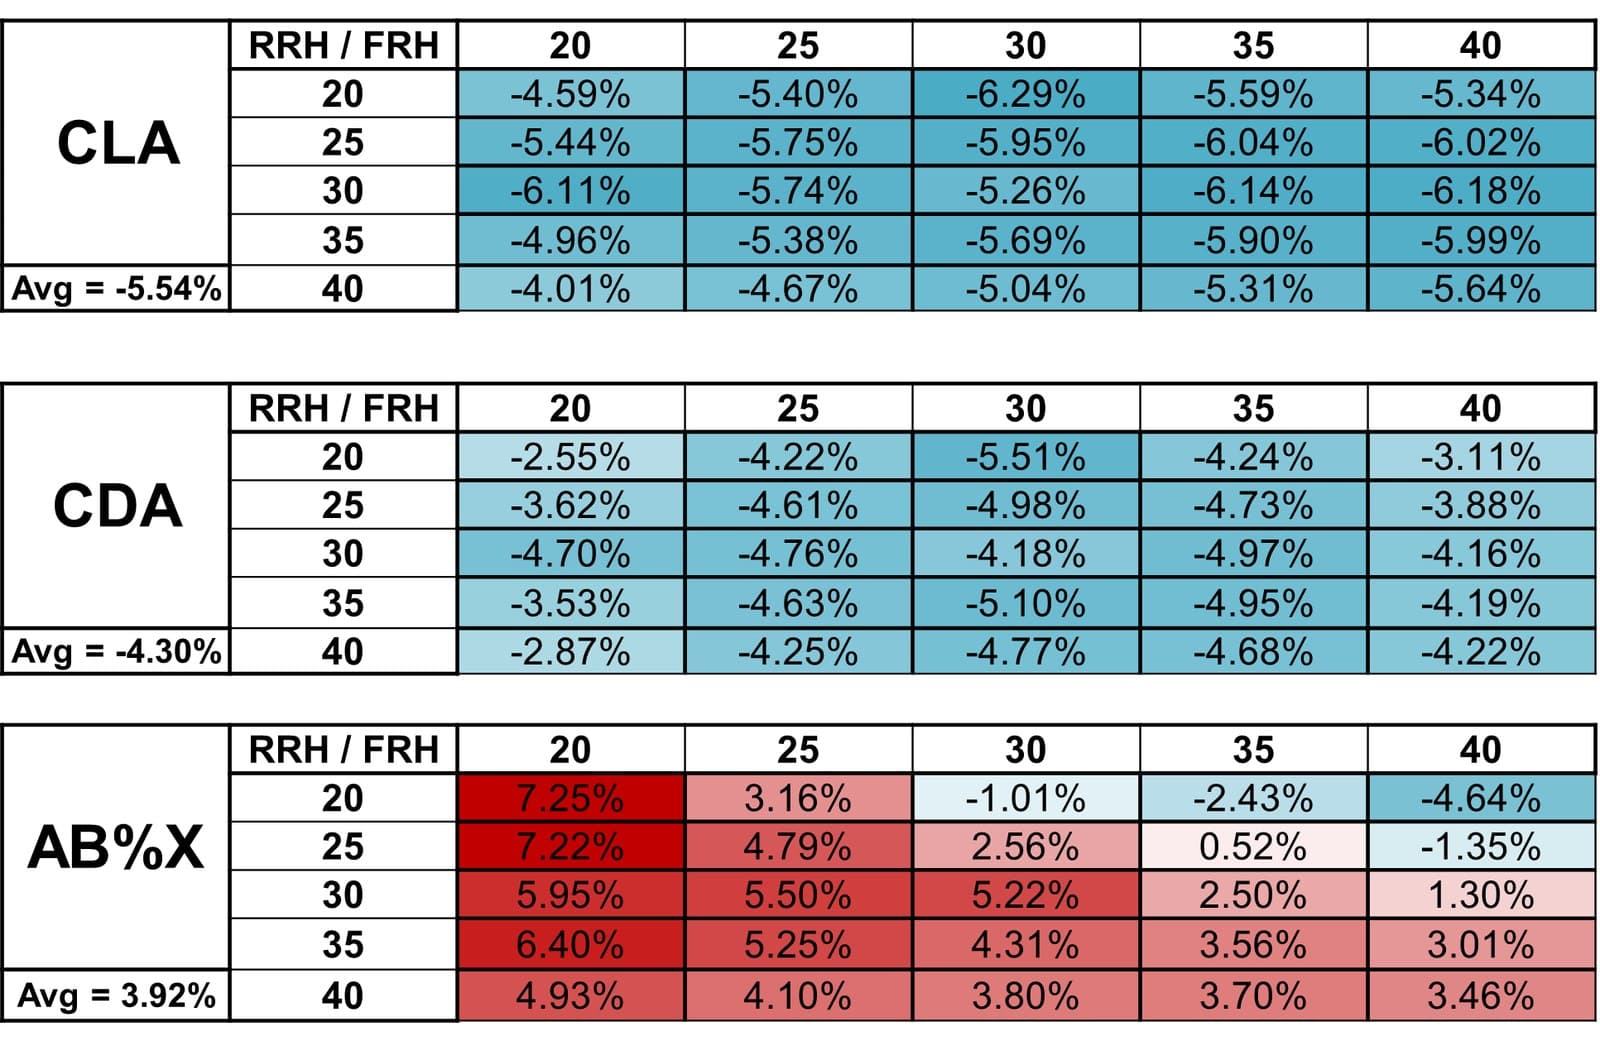
| Downforce — C_L·A | 94.46% | Averaged across ride heights |
| Drag — C_D·A | 95.70% | Across the tested speed range |
| Aerodynamic balance | 96.08% | Front/rear distribution |
| 2023 → 2025 | 83% → 95% | Two campaigns, +12 points |
Global coefficients agreeing is necessary but not sufficient — two models can reach the same total from different flow fields. Local comparison is what says the physics matches.
Validation on track
The tunnel gives controlled conditions; it does not give the ones the car races in. Several acquisition methods exist for an FSAE prototype — pressure taps at known coordinates, pitot grids mapping the surrounding pressure field — but the method chosen was hybrid: force sensors integrated into the suspension arms, estimating the loads reaching each wheel from both aerodynamics and mechanical load transfer.
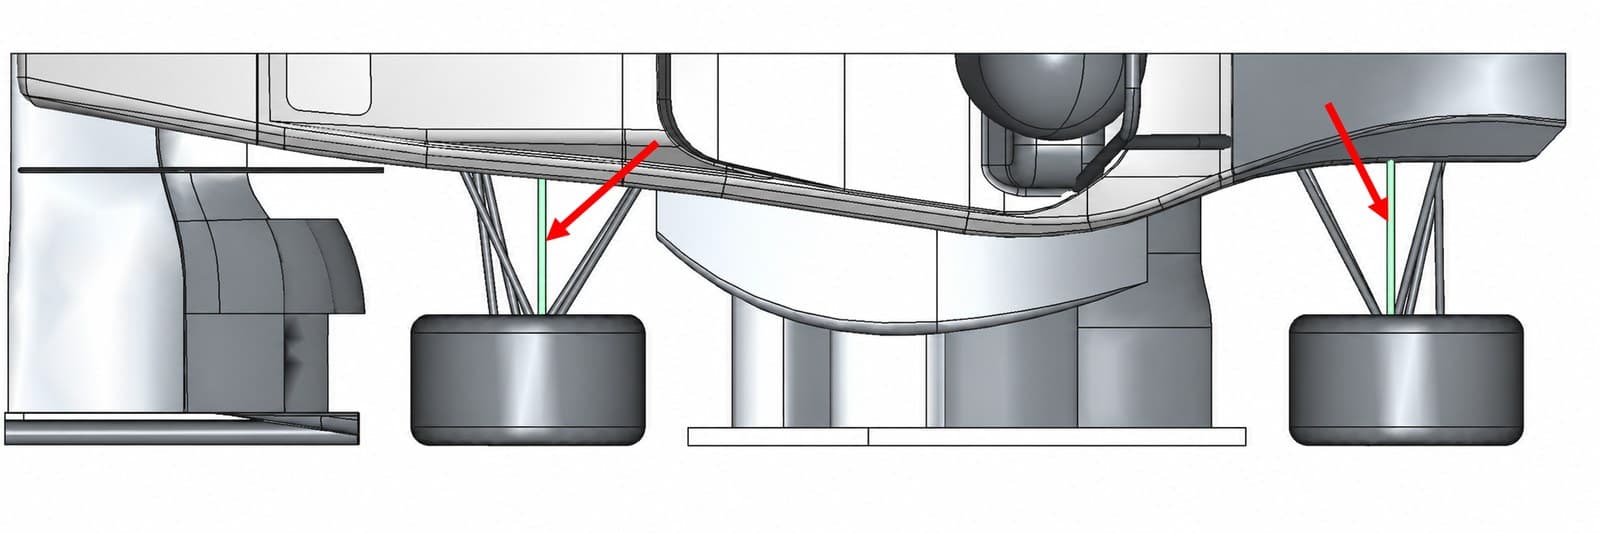
The cells sit on the arms tied to the dampers — pull-rod at the front, push-rod at the rear — which carry almost the entire vertical load.
They are calibrated at rest, so what gets read is variation against a known zero rather than an absolute value that would drift with temperature and preload.
Raw data from those cells carries extreme standard deviations: surface irregularities and elevation gradients drive large transient pitch and heave. Filtering discards anything the dampers rather than the air is dictating.
| Filter | Threshold | Reason |
|---|---|---|
| Speed | v < 12 m/s excluded | Aerodynamic load too small to separate from noise |
| Lateral acceleration | |a_y| > 0.1 excluded | Cornering transients dominated by dampers |
| Longitudinal acceleration | |a_x| > 0.2 excluded | Braking and traction load transfer |
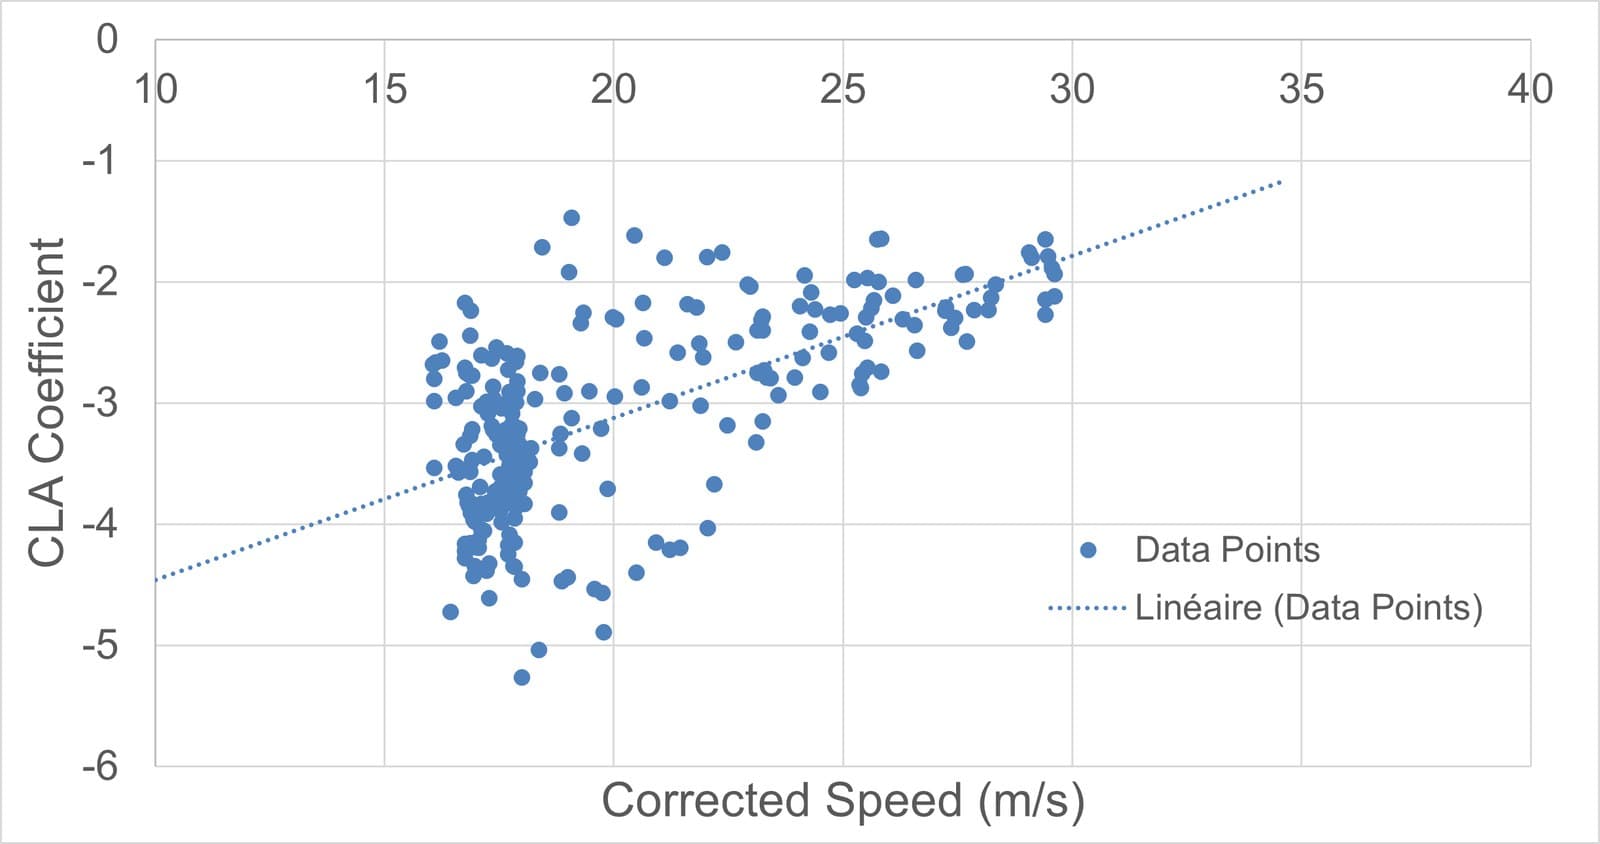
What survives is a downforce-against-speed map that can be laid directly over the solver output — the same quantity, measured instead of computed.
Track validation closes the loop the tunnel cannot: real ground effect, real wheel rotation, real surface, all at once.
It is coarser than the tunnel and it cannot isolate variables — which is exactly why both loops are needed rather than either alone.
What the campaigns changed
The tunnel exposed faults in the initial modelling that were corrected into a new working baseline — that is the point of the exercise, and the reason the number moved 12 points in two years. Lateral force predictions remain the weakest area, traced to insufficient mesh refinement in the wake, and a similar campaign is still owed to them.
The limitation neither loop escapes is that both are straight-line methods. Validating a genuinely cornering model demands facilities a student team cannot reach, which is what the cornering aerodynamics model exists to work around — using asymmetric yaw and roll runs from this campaign as its experimental anchor.
Published as Formule ETS technical report FETS-2025-01, released under CC BY. The report, the master sheet and the test plan are on the Archives page.